Profile of the Running ES Score & Positions of GeneSet Members on the Rank Ordered List
| Dataset | Set_03_truncNotch_versus_wtNotch.phenotype_truncNotch_versus_wtNotch.cls #wtNotch_versus_truncNotch.phenotype_truncNotch_versus_wtNotch.cls #wtNotch_versus_truncNotch_repos |
| Phenotype | phenotype_truncNotch_versus_wtNotch.cls#wtNotch_versus_truncNotch_repos |
| Upregulated in class | truncNotch |
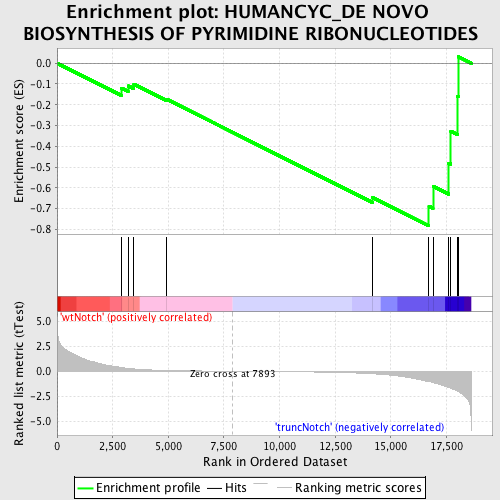
| GeneSet | HUMANCYC_DE NOVO BIOSYNTHESIS OF PYRIMIDINE RIBONUCLEOTIDES |
| Enrichment Score (ES) | -0.78381616 |
| Normalized Enrichment Score (NES) | -1.4579539 |
| Nominal p-value | 0.03057554 |
| FDR q-value | 0.52724427 |
| FWER p-Value | 1.0 |
| PROBE | DESCRIPTION (from dataset) | GENE SYMBOL | GENE_TITLE | RANK IN GENE LIST | RANK METRIC SCORE | RUNNING ES | CORE ENRICHMENT | |
|---|---|---|---|---|---|---|---|---|
| 1 | DHODH | 3170072 | 2885 | 0.378 | -0.1199 | No | ||
| 2 | NME1 | 770014 | 3193 | 0.288 | -0.1096 | No | ||
| 3 | NME7 | 60170 1230551 2850333 4200102 4560411 5090647 | 3450 | 0.234 | -0.1016 | No | ||
| 4 | NME4 | 3140736 5900446 | 4913 | 0.077 | -0.1731 | No | ||
| 5 | CTPS2 | 360647 3940110 | 14166 | -0.251 | -0.6469 | No | ||
| 6 | CTPS | 70451 1740132 | 16714 | -1.027 | -0.6883 | Yes | ||
| 7 | CAD | 2340717 | 16897 | -1.133 | -0.5926 | Yes | ||
| 8 | NME2 | 2190672 | 17605 | -1.607 | -0.4811 | Yes | ||
| 9 | NME6 | 510136 6380722 | 17698 | -1.696 | -0.3282 | Yes | ||
| 10 | UMPS | 2340541 4730438 | 17998 | -2.002 | -0.1581 | Yes | ||
| 11 | NME3 | 1660440 | 18048 | -2.055 | 0.0305 | Yes |

